WTI Oil
WTI Oil price rose further in early Thursday’s trading, an extension of the 3.5% rally on Wednesday, the biggest daily gain since Nov 17.
Worsening fundamentals on the closure of one of the largest oil fields in Libya and increased tensions around the Israel-Palestine war, inflated oil prices. Stronger than expected fall in US crude inventories (API report, released late Wednesday) additionally supported oil prices.
The technical picture on the
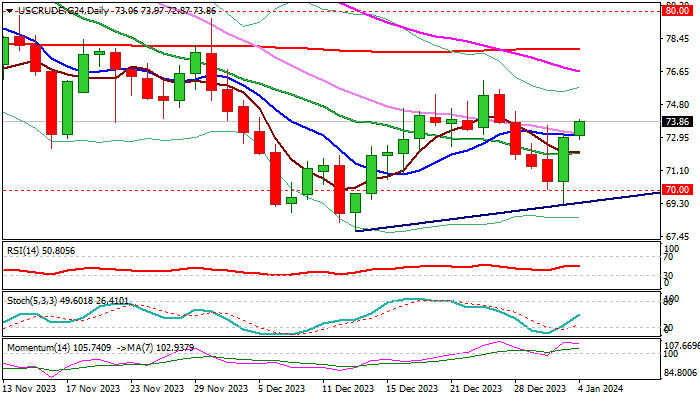
the daily chart has improved, following a bear trap under $70 level and subsequent bounce that left a bullish engulfing pattern and rose above daily MA’s (10,20,30), retracing so far over 61.8% of $76.16/$69.27 bear-leg).Strong bullish momentum and north-heading RSI add to a positive near-term outlook.
Bullseye
Fibo barrier at $74.53 (76.4% of $76.16/$69.27), ahead of key near-term resistance at $76.16 (Dec 26 high), violation of which would generate initial reversal signal.Daily close above broken 10DMA ($73.10) is needed to keep fresh bulls in play.Res: 74.00; 74.53; 75.36; 76.16.Sup: 73.53; 73.10; 72.72; 72.10.