USD: Mar ’24 is Up at 102.440.
Energies: Feb ’24 Crude is Up at 72.80.
Financials: The Mar ’24 30 Year T-Bond is Down 22 ticks and trading at 122.05.
Indices: The Dec ’23 S&P 500 emini ES contract is 56 ticks Lower and trading at 4715.50.
Gold: The Feb’24 Gold contract is trading Down at 2045.40.
Initial conclusion
This is not a correlated market. The USD is Up and Crude is Up which is not normal, and the 30 Year T-Bond is trading Lower. The Financials should always correlate with the US dollar such that if the dollar is Higher, then the bonds should follow and vice-versa. The S&P is Lower and Crude is trading Higher which is correlated. Gold is trading Lower which is correlated with the US dollar trading Up. I tend to believe that Gold has an inverse relationship with the US Dollar as when the US Dollar is down, Gold tends to rise in value and vice-versa.
Think of it as a seesaw, when one is up the other should be down. I point this out to you to make you aware that when we don’t have a correlated market, it means something is wrong. As traders you need to be aware of this and proceed with your eyes wide open. All of Asia is trading Mixed. Currently all of Europe is trading Lower.
Possible challenges to traders
- Average Hourly Earnings m/m is out at 8:30 AM EST. This is Major.
- Non-Farm Employment Change is out at 8:30 AM EST. This is Major.
- Unemployment Rate is out at 8:30 AM EST. This is Major.
- ISM Services PMI is out at 10 AM EST. This is Major.
- Factory Orders m/m is out at 10 AM EST. This is Major.
- FOMC Member Barkin Speaks at 1:30 PM EST. This is Major.
Treasuries
Traders, please note that we’ve changed the Bond instrument from the 30 year (ZB) to the 10 year (ZN). They work exactly the same.
We’ve elected to switch gears a bit and show correlation between the 10-year bond (ZN) and the S&P futures contract. The S&P contract is the Standard and Poor’s, and the purpose is to show reverse correlation between the two instruments. Remember it’s likened to a seesaw, when up goes up the other should go down and vice versa.
Yesterday the ZN migrated Higher at around 9:45 AM EST as the S&P hit a High at around the same time. If you look at the charts below the S&P gave a signal at around 9:45 AM and the ZN started its Upward trend. Look at the charts below and you’ll see a pattern for both assets. S&P hit a High at around 9:45 AM and migrated Lower.
These charts represent the newest version of MultiCharts and I’ve changed the timeframe to a 15-minute chart to display better. This represented a Long opportunity on the 10-year note, as a trader you could have netted about a dozen ticks per contract on this trade. Each tick is worth $15.625. Please note: the front month for the ZN is now Mar ’24. The S&P contract is now Mar’ 24. I’ve changed the format to filled Candlesticks (not hollow) such that it may be more apparent and visible.
Charts courtesy of MultiCharts built on an AMP platform
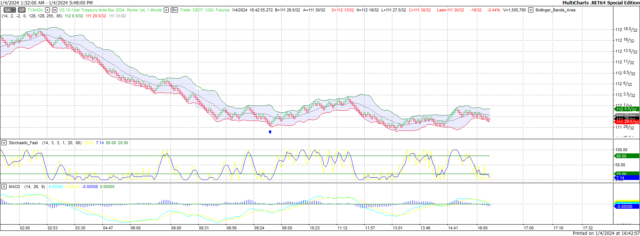
ZN – Mar 2024 – 01/04/24
-638400547741571229.png)
S&P – Mar 2024 – 01/04/24
Bias
Yesterday we gave the markets an Upside bias as both the USD and the Bonds were trading Lower Thursday morning and that usually represents an Upside Day. The market shad other ideas as the S&P and Nasdaq both traded Lower with only the Dow migrating into positive territory. The Dow closed 10 points Higher. Given that today is Jobs Friday our bias is Neutral.