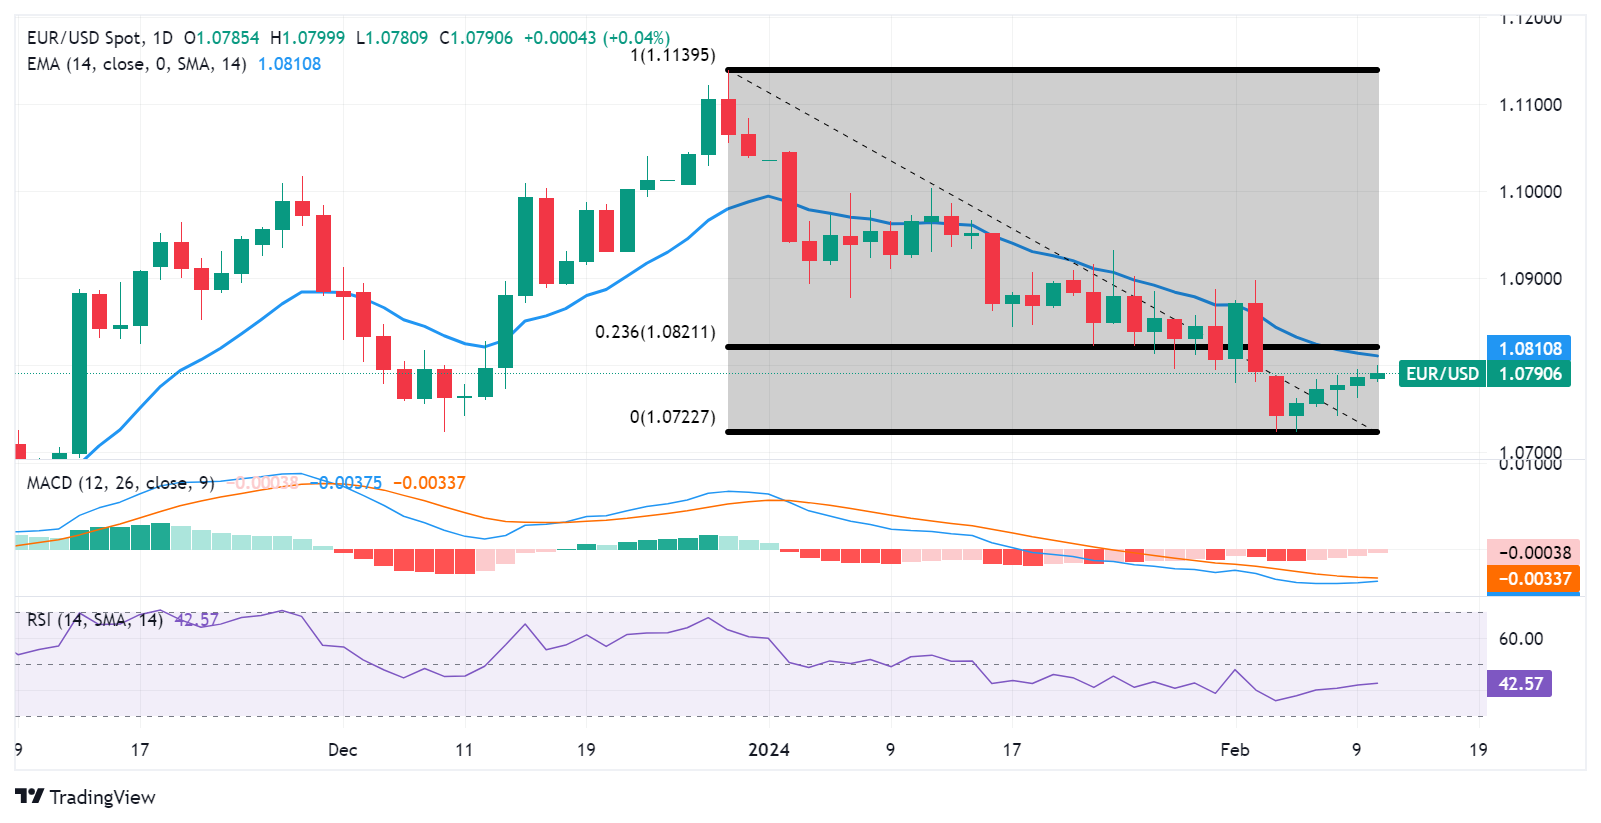
The EUR/USD pair shows signs of upward movement, possibly reaching the psychological resistance level at 1.0800. Technical analysis suggests a shift towards positive momentum, with support expected around 1.0750 and the previous week’s low at 1.0722.
In Monday’s Asian session, the EUR/USD pair extended its winning streak for the fifth consecutive session, edging closer to the 1.0790 level. Traders are closely monitoring the key resistance at 1.0800 and the 14-day Exponential Moving Average (EMA) at 1.0810.
A decisive break above the EMA could strengthen the upward momentum, targeting key levels such as the 23.6% Fibonacci retracement level at 1.0821 and the significant barrier at 1.0850. Further upside potential may lead the pair towards the psychological level at 1.0900.
Technical indicators present a mixed outlook, with the 14-day Relative Strength Index (RSI) indicating bearish momentum below the 50 mark. However, the Moving Average Convergence Divergence (MACD) shows signs of convergence below the signal line, suggesting a potential shift towards upside momentum.
Traders may await further confirmation of the directional trend before making trading decisions. On the downside, immediate support is anticipated at 1.0750, followed by 1.0722. A breach below these levels could lead to further downward pressure, potentially targeting the psychological support at 1.0700. Market sentiment will be closely monitored around these levels for potential shifts.
EUR/USD: Daily Chart
EUR/USD: ADDITIONAL TECHNICAL LEVELS
| OVERVIEW | |
|---|---|
| Today last price | 1.079 |
| Today Daily Change | 0.0004 |
| Today Daily Change % | 0.04 |
| Today daily open | 1.0786 |
| TRENDS | |
|---|---|
| Daily SMA20 | 1.0838 |
| Daily SMA50 | 1.0894 |
| Daily SMA100 | 1.0788 |
| Daily SMA200 | 1.0833 |
| LEVELS | |
|---|---|
| Previous Daily High | 1.0795 |
| Previous Daily Low | 1.0762 |
| Previous Weekly High | 1.0795 |
| Previous Weekly Low | 1.0723 |
| Previous Monthly High | 1.1046 |
| Previous Monthly Low | 1.0795 |
| Daily Fibonacci 38.2% | 1.0783 |
| Daily Fibonacci 61.8% | 1.0775 |
| Daily Pivot Point S1 | 1.0767 |
| Daily Pivot Point S2 | 1.0748 |
| Daily Pivot Point S3 | 1.0734 |
| Daily Pivot Point R1 | 1.08 |
| Daily Pivot Point R2 | 1.0814 |
| Daily Pivot Point R3 | 1.0833 |