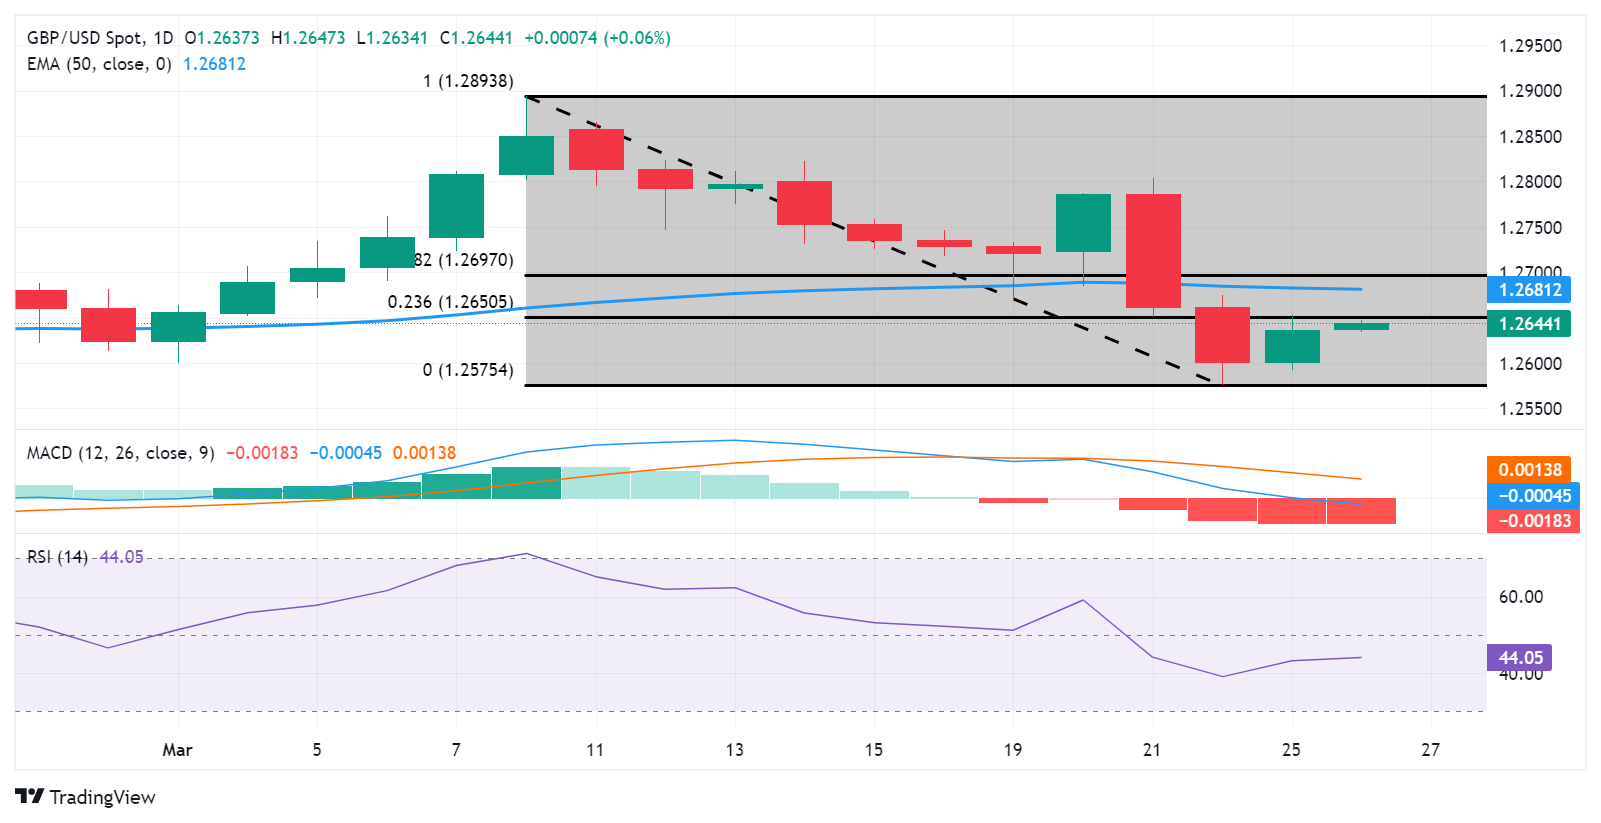
GBP/USD is currently around 1.2640 in Asian trading today, aiming to surpass immediate resistance at 1.2650, which coincides with the 23.6% Fibonacci retracement level. This level acts as a significant barrier to the pair’s upward movement.
If GBP/USD breaks above 1.2650, it might encounter further resistance at the 50-day Exponential Moving Average (EMA) around 1.2681. Beyond that, the psychological hurdle at 1.2700 could come into play.
Analyzing the technical indicators, the 14-day Relative Strength Index (RSI) suggests a bearish trend as it remains below 50. Similarly, the Moving Average Convergence Divergence (MACD) confirms this bearish momentum, with the MACD line below the centerline and showing divergence below the signal line.
On the downside, if GBP/USD fails to hold above 1.2650, the psychological support level could be tested at 1.2600. A breach below this level may lead to a revisit of March’s low at 1.2575, followed by significant support at 1.2550.
GBP/USD: Daily Chart