- AUD/USD gains 0.34% on positive sentiment, defying a negative housing market report impact.
- Neutral bias with an upside tilt; breach of 200-DMA at 0.6579 may target 0.6600 and 0.6639.
- Downside risks include 200-DMA at 0.6579 and the January 17 low of 0.6523 before testing 0.6500.
The Australian Dollar (AUD) registers solid gains from the US Dollar (USD) amid an upbeat market mood following the release of an improvement in consumer sentiment and a bad housing market report. At the time of writing, the AUD/USD exchanges hands at 0.6373, gains 0.34%.
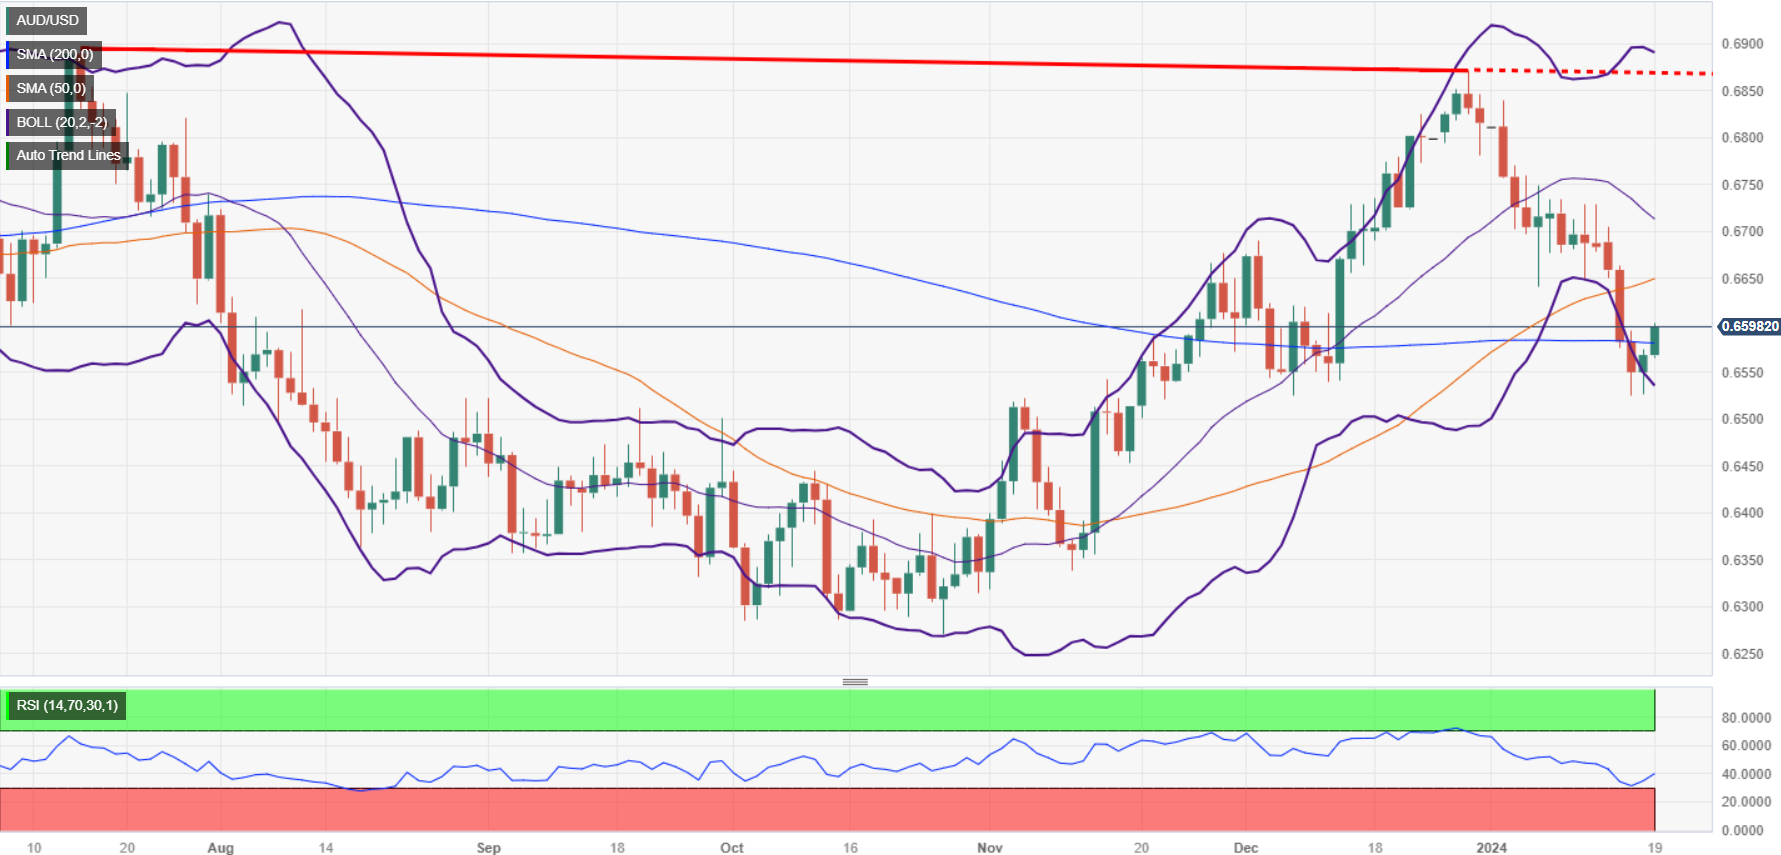
The daily chart portrays the pair as neutral biased, though tilted to the upside, after breaking above the 200-day moving average (DMA) at 0.6579. Further upside is seen at 0.6600, followed by the 50-day moving average (DMA) at 0.6639. Once surpassed, the next stop would be the January 12 cycle high at turned resistance at 0.6728.
For a bearish resumption, AUD/USD first support would be the 200-DMA at 0.6579, followed by the January 17 daily low of 0.6523. A drop below that level, and sellers could challenge the 0.6500 figure
AUD/USD Price Action – Daily Chart

AUD/USD Technical Levels
AUD/USD
| OVERVIEW | |
|---|---|
| Today last price | 0.6598 |
| Today Daily Change | 0.0030 |
| Today Daily Change % | 0.46 |
| Today daily open | 0.6568 |
| TRENDS | |
|---|---|
| Daily SMA20 | 0.6723 |
| Daily SMA50 | 0.6645 |
| Daily SMA100 | 0.6518 |
| Daily SMA200 | 0.6582 |
| LEVELS | |
|---|---|
| Previous Daily High | 0.6575 |
| Previous Daily Low | 0.6526 |
| Previous Weekly High | 0.6735 |
| Previous Weekly Low | 0.6647 |
| Previous Monthly High | 0.6871 |
| Previous Monthly Low | 0.6526 |
| Daily Fibonacci 38.2% | 0.6556 |
| Daily Fibonacci 61.8% | 0.6545 |
| Daily Pivot Point S1 | 0.6538 |
| Daily Pivot Point S2 | 0.6508 |
| Daily Pivot Point S3 | 0.6489 |
| Daily Pivot Point R1 | 0.6587 |
| Daily Pivot Point R2 | 0.6605 |
| Daily Pivot Point R3 | 0.6636 |

