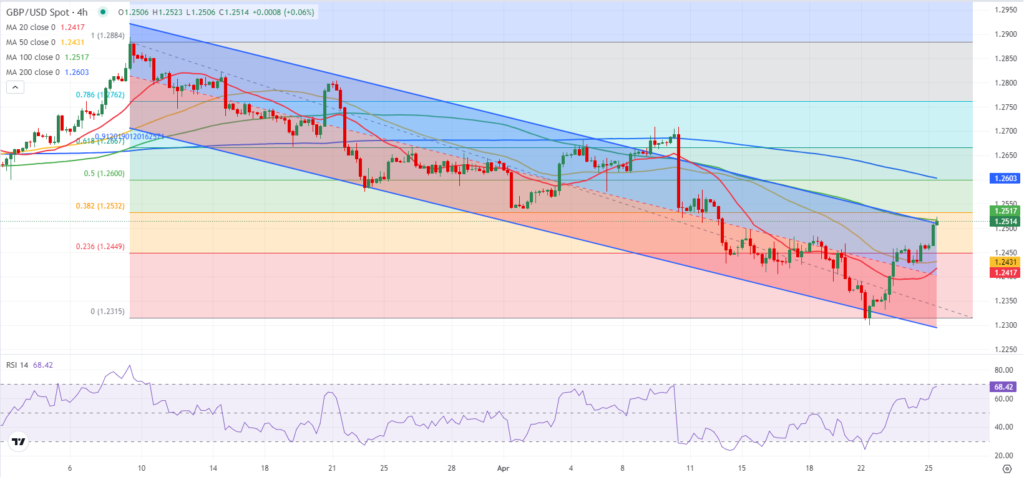
- GBP/USD regained its traction and climbed above 1.2500 on Thursday.
- The US Dollar stays under selling pressure ahead of key data releases.
- The US economy is forecast to grow at an annual rate of 2.5% in Q1.
GBP/USD saw an upward trend for the second consecutive day on Wednesday, breaking above 1.2500 for the first time in almost two weeks on Thursday. The short-term technical outlook for the pair suggests a bullish trend.
The US Dollar’s (USD) recent weakness has contributed to GBP/USD’s rise during the European trading session. A decline in US stock index futures indicates a risk-off mood in the market, largely due to significant drops in major stocks like Meta.

Later today, the US Bureau of Economic Analysis is set to release its preliminary report on the GDP growth for the first quarter. Analysts predict the US economy will show an expansion of 2.5% annually, down from the robust 3.4% growth seen in the final quarter of 2023.
Weak PMI figures from the US earlier in the week have put downward pressure on the USD. Although there is still a more than 80% probability that the Federal Reserve will keep interest rates unchanged in June, a lower-than-expected GDP figure could affect the Fed’s rate decisions for the remainder of the year, potentially leading to a further drop in the USD. Conversely, if the GDP data reveals stronger-than-anticipated growth, GBP/USD might decline.
Currently, GBP/USD is trading just over 1.2500. This level coincides with the top boundary of the descending regression channel and the 100-period Simple Moving Average (SMA) on the 4-hour chart. If this level holds as support, the next resistance might be around 1.2530 (38.2% Fibonacci retracement of the recent downward trend), followed by 1.2560 (200-day SMA).
Should GBP/USD not maintain its position above 1.2500, the sentiment among buyers could weaken. In that case, support levels might appear at 1.2450 (23.6% Fibonacci retracement), 1.2430 (50-period SMA), and 1.2400 (a notable psychological and static level).
