The coming week in the markets is likely to see a similar or lower level of volatility compared to last week, as there will be a much smaller amount of important economic data releases, with the major event being the policy meeting (Cash Rate and Rate Statement) at the Reserve Bank of Australia.
The difference between success and failure in Forex / CFD trading is highly likely to depend mostly upon which assets you choose to trade each week and in which direction, and not on the exact methods you might use to determine trade entries and exits.
So, when starting the week, it is a good idea to look at the big picture of what is developing in the market as a whole, and how such developments and affected by macro fundamentals, technical factors, and market sentiment.
Read on to get my weekly analysis below.
Fundamental Analysis & Market Sentiment
I wrote in my previous piece on 29th October that the best trade opportunities for the week were likely to be:
- Long of the USD/JPY currency pair following a strongly bullish daily close above ¥150. This set up on Tuesday, and unfortunately the price declined by 1.54% from there to the weekly close.
- Long of Gold following a new strongly bullish daily close above $2,070. This did not set up.
- Short of the GBP/USD currency pair following a daily close below $1.2000. This did not set up.
- Long of Cocoa futures. This asset rose by 1.88% over the week.
These trades produced an overall win of 0.34%.
Last week saw a marked change in risk sentiment, driven mostly by the FOMC’s statement which effectively ruled out any more rate hikes in 2023. The fact that the war in the Middle East has not widened has also helped risk sentiment. The US Dollar fell hard against all major currencies following the Fed’s release Wednesday and stock markets rose strongly, with some major US indices making a new 2-year high price. US Treasury Yields also fell strongly, with even the 2-year yield ending the week well below 5%, leading to speculation that we may have just seen a major turn in the market. The Fed left its rate unchanged at 5.50%, which was no surprise, as the markets had priced in a 97% chance of that happening.
Last week was very busy in terms of major data releases, with US non-farm payrolls coming in weaker than expected, the unemployment rate rising slightly contrary to expectations, and average hourly earnings rising more slowly than was forecasted. This adds more weight to the Fed’s rate hike pause and paradoxically probably helps to boost US stock markets.
The other major events last week were policy meetings at the Bank of Japan and the Bank of England. There were no major surprises at the Bank of England, but the Bank of Japan made a smaller than expected tweak to its yield curve control, which sent the Yen tumbling for a day or so.
Last week’s other key data releases were:
- US JOLTS Job Openings – this came in a little stronger than expected.
- German Preliminary CPI (inflation) data – this came in at zero, lower than expected, giving further credence to the idea that inflationary pressures are subsiding in major economies.
- Swiss CPI (inflation) – this came in at a very low rate, as expected.
- Spanish Flash CPI (inflation) – this came in considerably lower than expected, giving further credence to the idea that inflationary pressures are subsiding in major economies.
- Chinese Manufacturing PMI – this was a little lower than expected.
- Canadian GDP – slightly lower than expected, at zero.
- US ISM Services PMI – lower than expected, giving more weight to the case that the US economy is cooling.
- US Employment Cost Index – more or less as expected.
- US CB Consumer Confidence – a little higher than expected.
- US ISM Manufacturing PMI – lower than expected.
- US Unemployment Claims – approximately as expected.
- Canadian Unemployment – this was worse than expected, with the rate rising to 5.7%.
- New Zealand Unemployment Rate – as expected.
The Week Ahead: 6th November – 10th November
The coming week in the markets is likely to see a similar or lower level of volatility compared to last week, as there will be a much smaller amount of important economic data releases, with the major event being the policy meeting (Cash Rate and Rate Statement) at the Reserve Bank of Australia. This week’s key data releases are, in order of importance:
- RBA Cash Rate & Rate Statement
- UK GDP
- Bank of Japan Governor Press Conference
- New Zealand Inflation Expectations
- Chinese CPI (inflation) data
- US Preliminary UoM Consumer Sentiment
- US Unemployment Claims
Technical Analysis
US Dollar Index
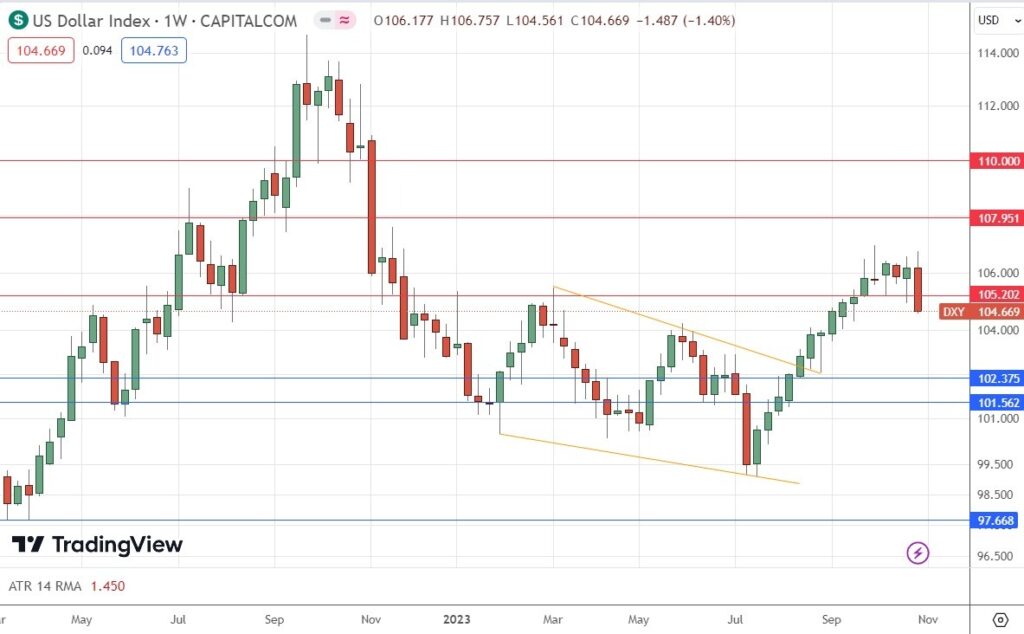
The US Dollar Index printed a strongly bearish outside bar last week, making its strongest fall since early July. Additional bullish technical factors were the price closing right on the low of the week’s range, and the price breaking well below the former support level at 105.20, which has likely now flipped to become new resistance.
Despite these bearish factors, the price remains within a long-term bullish trend. However, the bearish momentum is driven by a more dovish Federal Reserve, and that is likely to keep the greenback falling for a while at least.
I would be very careful taking any trades in the Forex market right now, as the Dollar is strongly counter trend. However, during the early part of this week, trades against the Dollar are likely to have the best chance.

USD/JPY
The USD/JPY currency pair printed a large bearish pin bar over the week, which completely engulfed the small bearish pin bar it made during the previous week. This is a bearish sign, enhanced by the fact the bar is large and rejects an area very near a 30-year high, including the big round number at ¥150.
These are all very bearish signs, with the main driver being the major turn seen last week in the US Dollar, driven by a more dovish Federal Reserve.
Despite the long-term bullish trend here, this looks as if it may be a major long-term bearish reversal, giving a potential speculative short trade entry opportunity.

NZD/USD
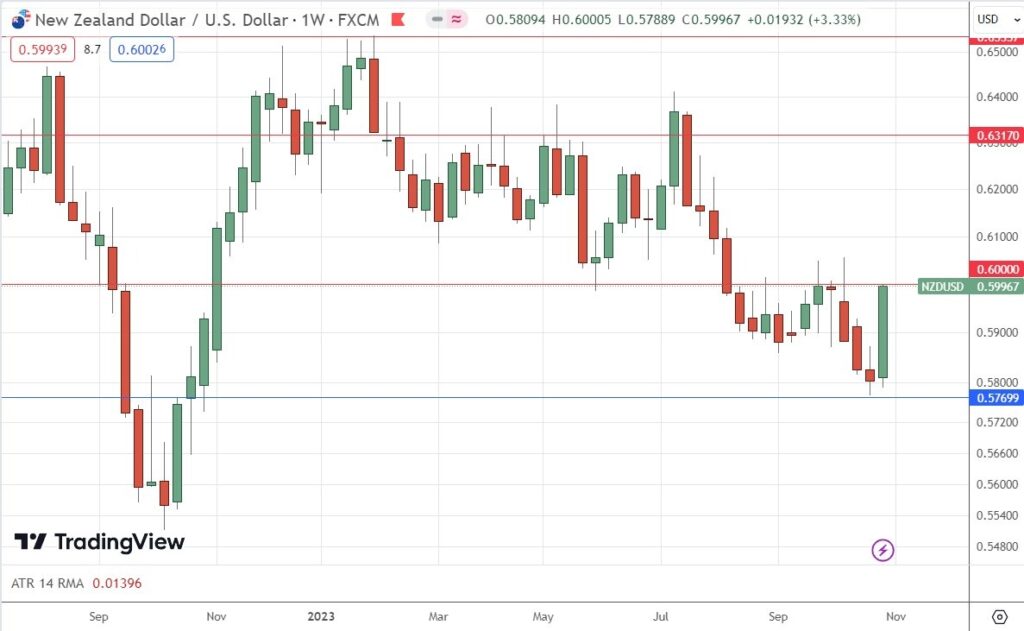
The NZD/USD currency pair bounced back very strongly last week, with the Kiwi making a huge gain against the greenback. The price rose by more than has been seen in over 1 year, and closed right on the high of its range, both of which are bullish signs.
However, bulls should beware of the fact that this move is strongly counter trend, and also that the price is just below a major resistance level which is confluent with the huge round number at $0.6000.
There may be a chance here for a short trade off $0.6000 or a higher resistance point, as such strong counter-trend volatility typically leads to a strong trend resumption, but much will depend on whether the US Dollar recovers despite the more dovish FOMC statement last week.
The best bet here may be a day trade short.

NASDAQ 100 Index
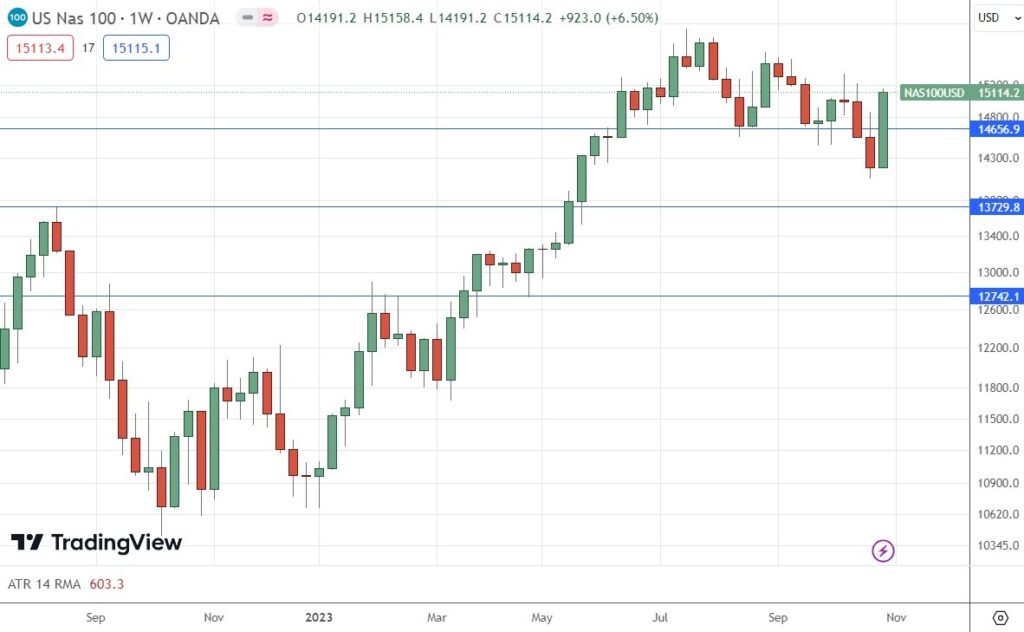
The NASDAQ 100 Index printed a strongly bullish candlestick, which was the biggest weekly rise seen here in over one year. The price closed right on the high of its range. These are bullish signs. However, bulls may well run out of momentum soon. A look at the price chart shows that last week closed in an area of minor resistance, shown by the upper wicks of previous candlesticks most recently reaching this price area.

Cocoa Futures
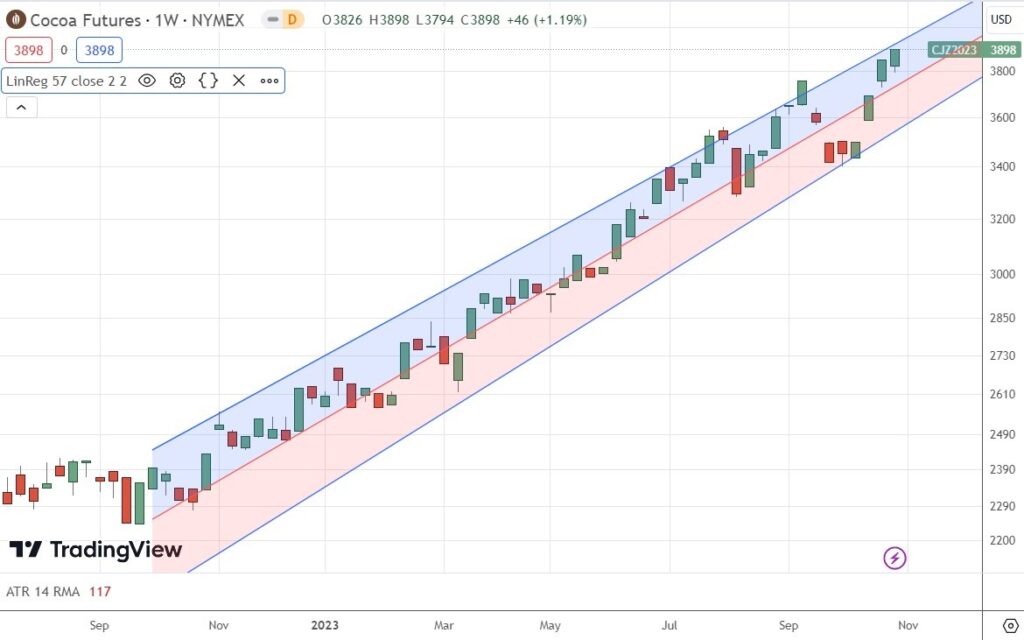
Cocoa futures have been in a strong bullish trend for over a year now. The price chart below applies a linear regression analysis to the past year and shows graphically what a great opportunity this has been on the long side.
The weekly candlestick was firmly bullish, closing right on its high at a multi-year high price.
It is always a bit aggressive to enter without a pullback, but this is a strong trend that shows no sign of stopping on ever-increasing global demand for the superfood cocoa.
Trading commodities long on breakouts to new 6-month highs has been a very profitable strategy over recent years.

