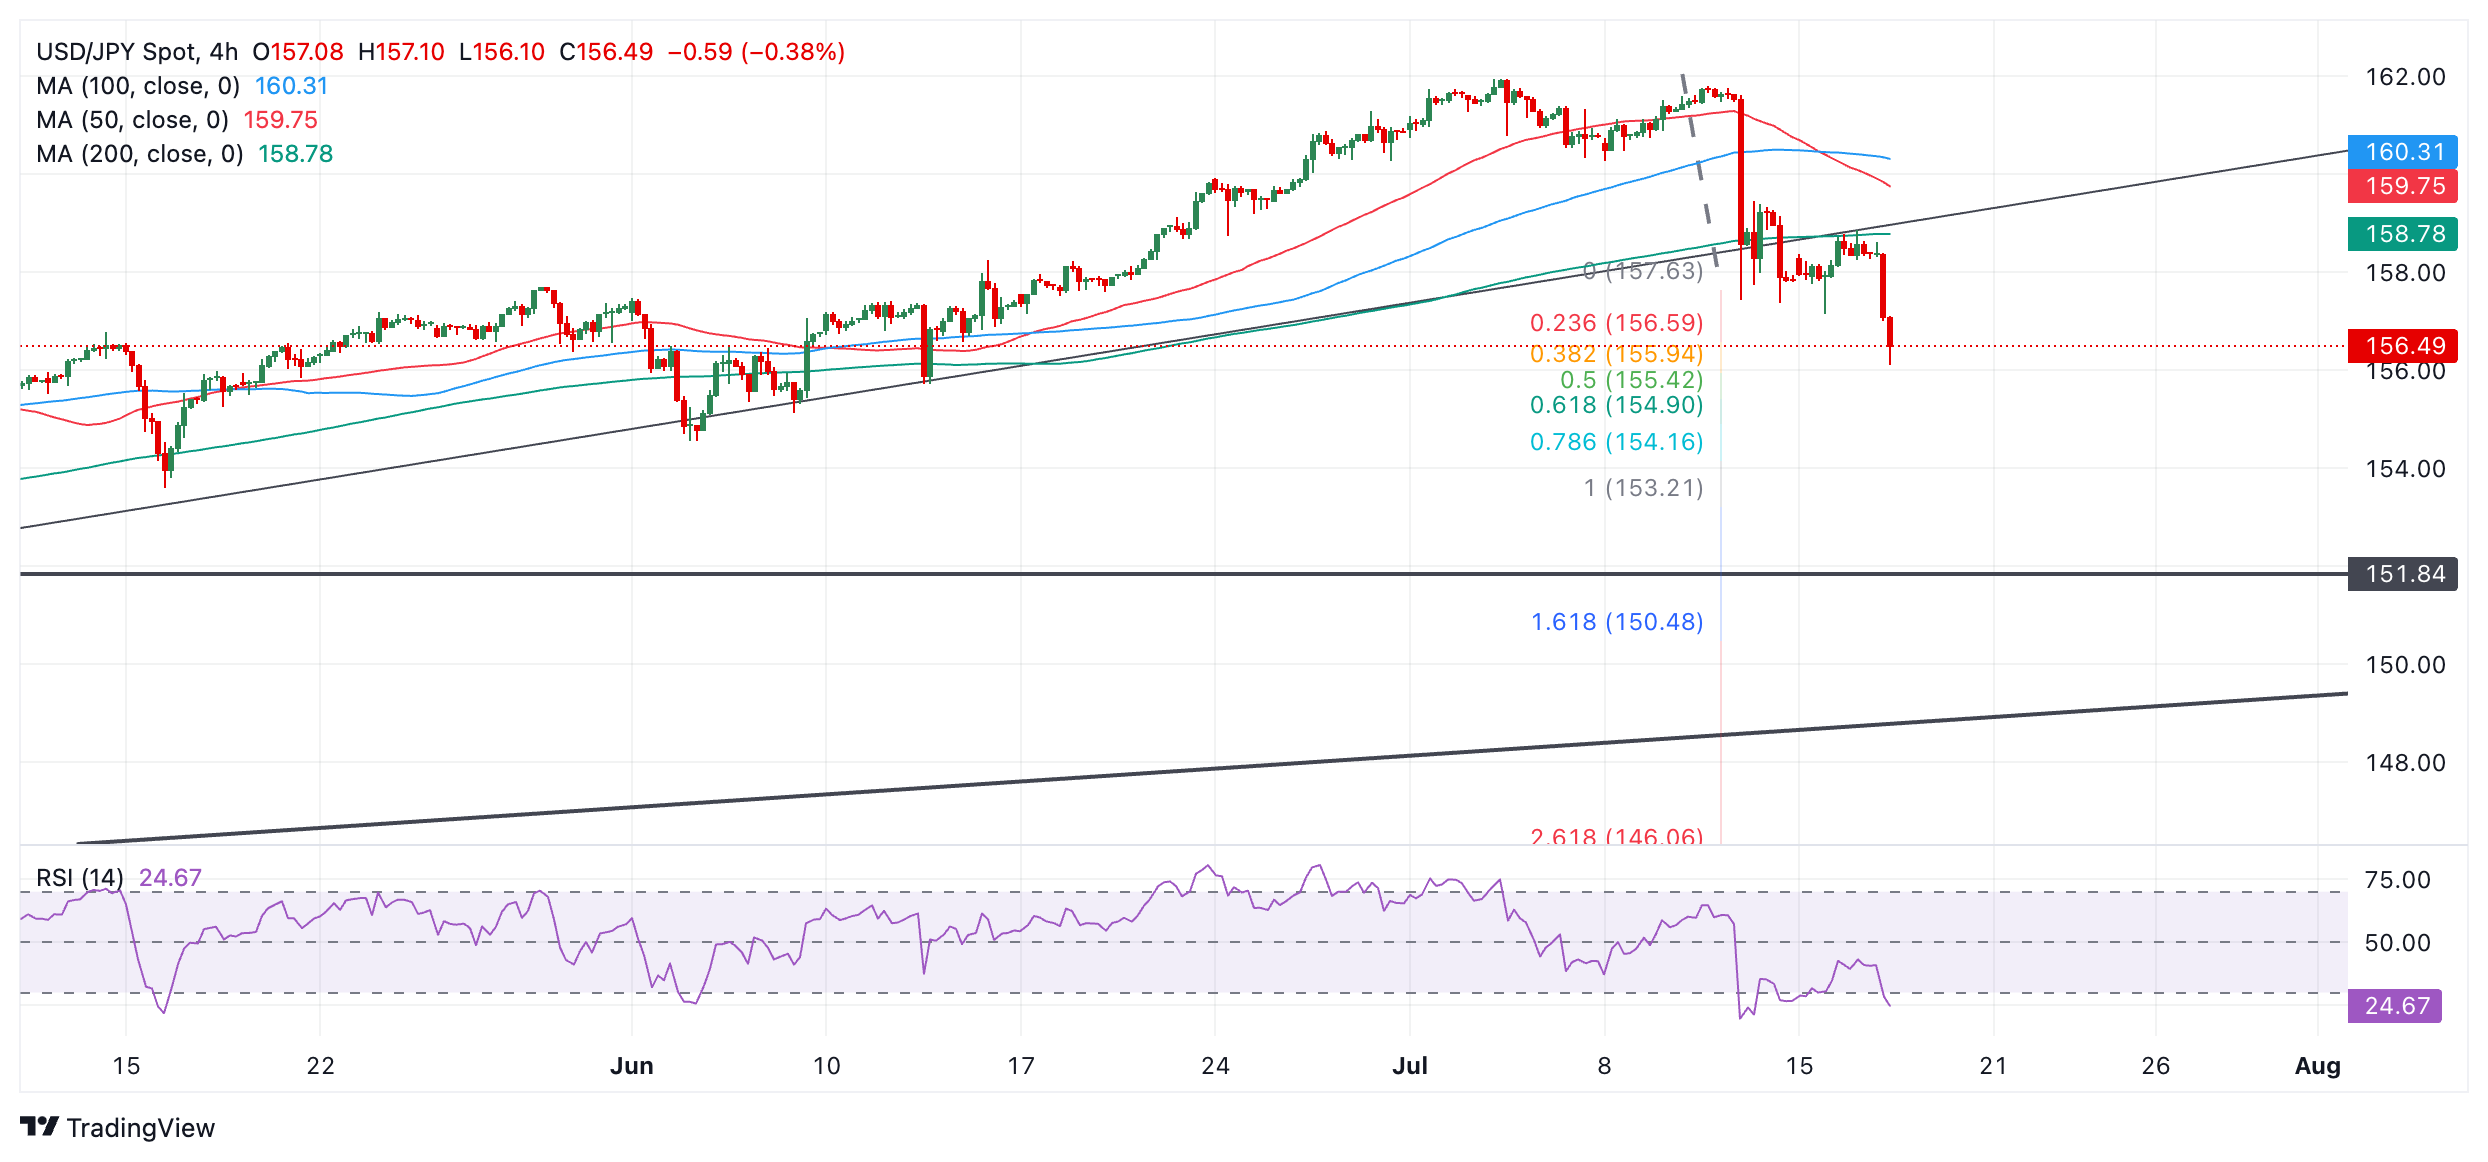
- USD/JPY is rapidly selling off and is now probably in a downtrend on a short and medium-term basis.
- The pair will probably continue declining to targets in the lower 150s.
- RSI is oversold, raising the risk of a correction or consolidation forming.
USD/JPY is declining steeply from its early July highs. After peaking at 161.95 on July 3 it has fallen over five Japanese Yen to the 156.50s on July 17.
The break below the major trendline at 158.45 on July 13 was a gamechanger for the pair and taken together with the more recent break below the 157.15 July 15 low, has given the chart a much more bearish aspect.
The short-term trend is bearish and the intermediate term trend is now also probably negative too. Given the old adage that “the trend is your friend” the odds favor a continuation lower over those timeframes.
USD/JPY Daily Chart

How much lower could USD/JPY go? The next immediate target is at 154.90, which is the 61.8% Fibonacci extension of the down move prior to the trendline break extrapolated lower. This is followed by 153.21, the 100% extrapolation of the same.
A more bearish scenario could even envisage price falling to 151.84 and a key support level (October 2021 high).
The Relative Strength Index (RSI) is in oversold territory indicating a rising chance of a pullback or consolidation delaying the pair’s descent.
