- EUR/USD hits 18-week high on Friday.
- Pre-holiday markets are producing some rough chop heading towards the Friday close.
- Slowing US inflation is pushing down the Greenback as markets bet on rate cuts.
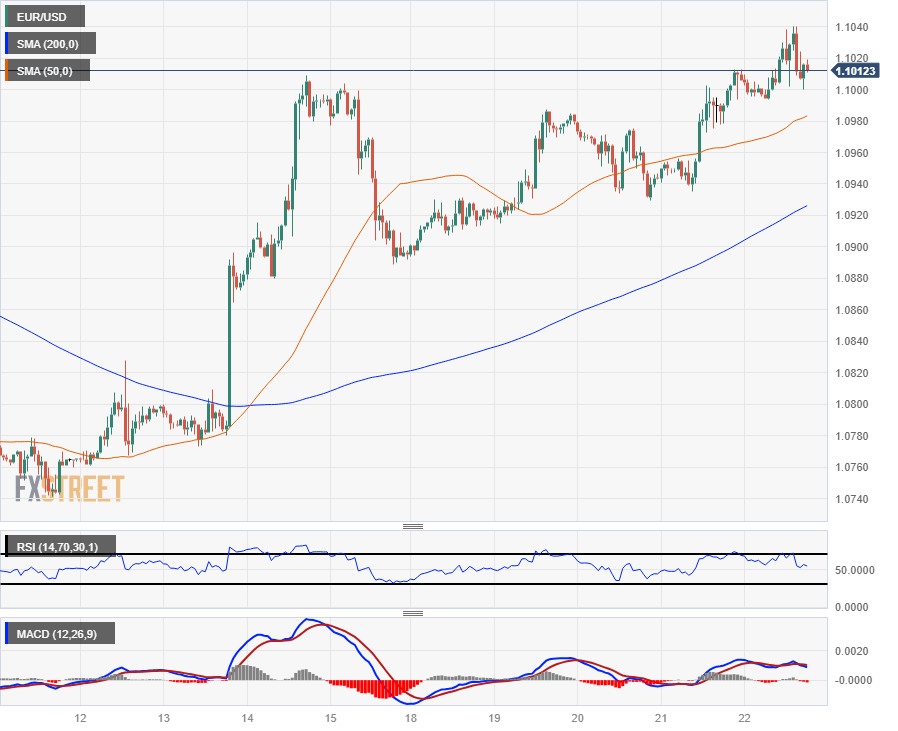
The EUR/USD climbed into an 18-week high at 1.1040 before slipping back towards 1.1000 as markets wind up operations before heading into the holiday break. US inflation missed the mark on Friday, printing below expectations and keeping investor expectations of Federal Reserve (Fed) rate cuts accelerating in 2024.
US Personal Consumption Expenditure (PCE) Price Index softened more than expected on Friday with the Core Annualized PCE Price Index for the year through November printing at 3.2%, below the forecast 3.3% and even further back from October’s YoY print of 3.4% (revised down slightly from 3.5%).
Money markets are ramping up their expectations of a faster pace of rate cuts from the Federal Reserve (Fed) through 2024 on the back of inflation metrics that continue to decline faster than most models can predict. Investor expectations have now run far ahead of the Fed’s own rate expectations looking forward, with money markets pricing in upwards of 160 basis points in Fed rate cuts, with some betting the rate cut cycle begins as soon as next March, while the Fed’s dot plot of interest rate expectations only sees 75 basis points in reductions by the end of 2024.
The market’s USD-short momentum was limited by a beat in US Durable Goods Orders, which printed at 5.4% for November versus October’s -5.1% (revised up slightly from -5.4%), showing the US economy may still be firm enough that the Fed might get away with fewer rate cuts than many expect.
EUR/USD Technical Outlook
Despite the US Dollar’s moderate pullback late Friday, the Greenback remains firmly down on the week, in the red by nearly a third of a percent against the Euro from Monday’s opening bids.
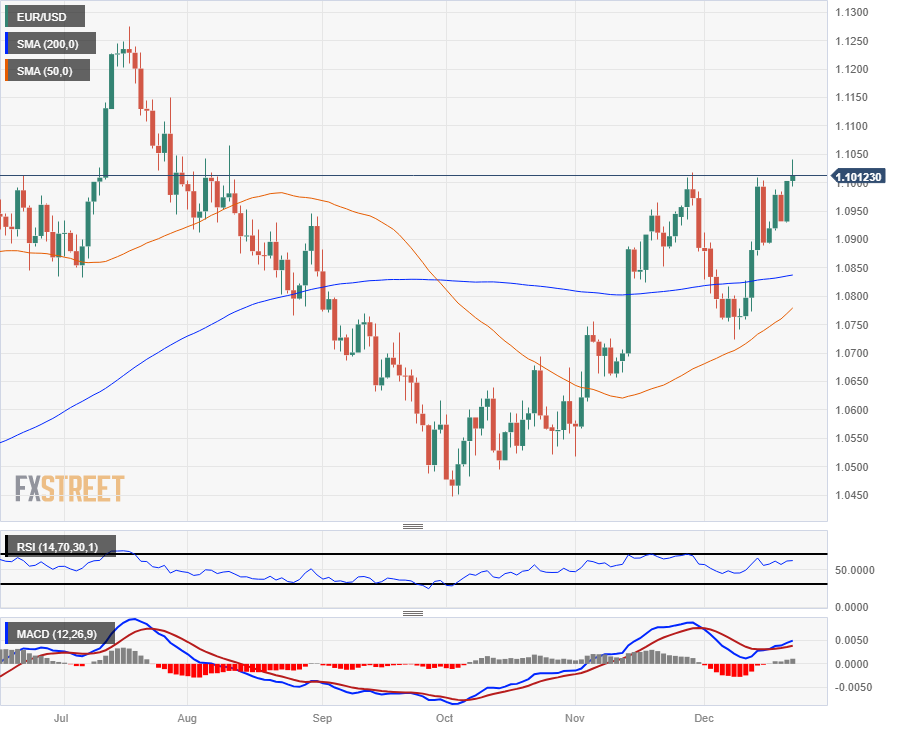
The US Dollar is still up on the day against the Euro, and a green close here will see the EUR/USD close in the green for seven of the last nine straight trading week.
Technicals are leaning into the bullish side, leaving a wake of technical support flags in the pair’s wake on its rise from October’s early lows near 1.0450. The last meaningful swing low saw a turnaround point at 1.9793, and the 200-day Simple Moving Average (SMA) rising towards 1.0850.
EUR/USD Hourly Chart

EUR/USD Daily Chart

EUR/USD Technical Levels
EUR/USD
| OVERVIEW | |
|---|---|
| Today last price | 1.1018 |
| Today Daily Change | 0.0015 |
| Today Daily Change % | 0.14 |
| Today daily open | 1.1003 |
| TRENDS | |
|---|---|
| Daily SMA20 | 1.0887 |
| Daily SMA50 | 1.0769 |
| Daily SMA100 | 1.0755 |
| Daily SMA200 | 1.0836 |
| LEVELS | |
|---|---|
| Previous Daily High | 1.1003 |
| Previous Daily Low | 1.093 |
| Previous Weekly High | 1.1009 |
| Previous Weekly Low | 1.0742 |
| Previous Monthly High | 1.1017 |
| Previous Monthly Low | 1.0517 |
| Daily Fibonacci 38.2% | 1.0975 |
| Daily Fibonacci 61.8% | 1.0958 |
| Daily Pivot Point S1 | 1.0954 |
| Daily Pivot Point S2 | 1.0905 |
| Daily Pivot Point S3 | 1.0881 |
| Daily Pivot Point R1 | 1.1027 |
| Daily Pivot Point R2 | 1.1052 |
| Daily Pivot Point R3 | 1.1101 |
