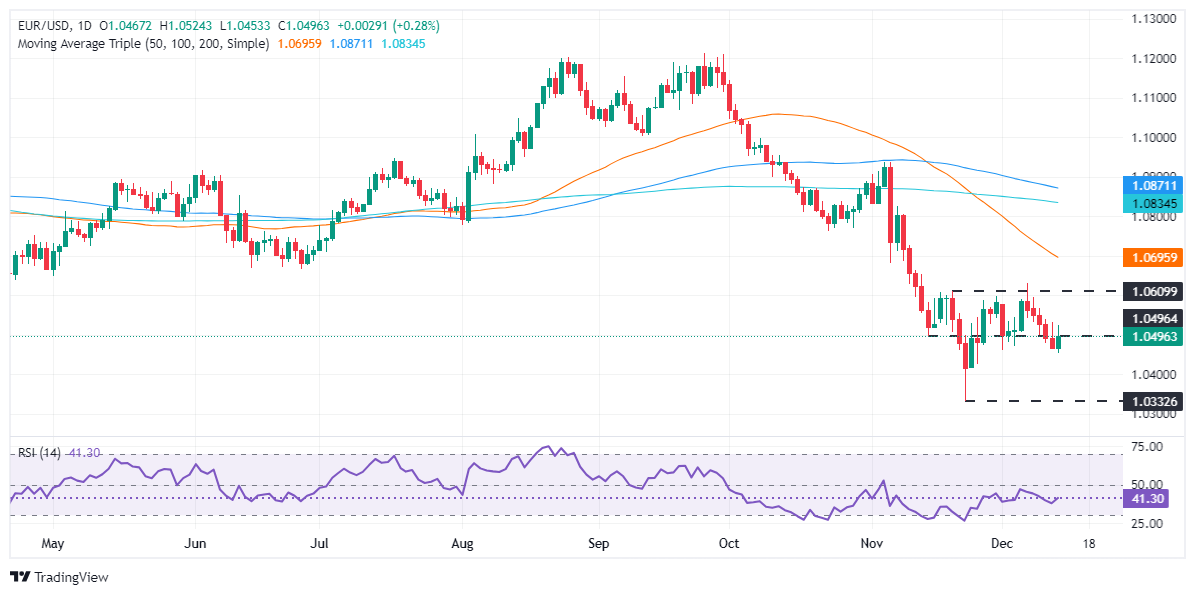
EUR/USD is currently hovering around the 1.0500 level, recovering slightly to 1.0498 after testing weekly lows. The pair remains in a delicate balance, with potential for upward movement if it sustains above 1.0500. Key resistance levels are positioned at 1.0530 and 1.0600, while support is located near 1.0452 and the year-to-date (YTD) low of 1.0331.
Despite the European Central Bank’s (ECB) rate cut on Thursday, which initially pushed EUR/USD toward its weekly low of 1.0452, buyers have stepped in and lifted the pair back to its current level of 1.0498. The EUR/USD has struggled to move far from the 1.0500 mark for five consecutive days.
EUR/USD Technical Outlook:
The daily chart indicates that EUR/USD is maintaining its position around 1.0500, unable to decisively move lower and test the YTD low at 1.0331. Although the pair is forming a series of lower highs, extending the downtrend may prove challenging.
The Relative Strength Index (RSI) shows increasing buying momentum, which could provide the push needed for the pair to close above 1.0500. A sustained move above this level would target key resistance levels at 1.0530 (December 12 high), followed by 1.0600, and last week’s peak of 1.0629.
On the other hand, if EUR/USD fails to hold above 1.0500, it could extend its losses, with 1.0452 as the immediate support. A break below this level would open the door for further declines, first targeting 1.0424 (November 26 low) and potentially reaching 1.0331 (November 22 swing low).
EUR/USD Price Chart – Daily

Euro PRICE Today
The table below shows the percentage change of Euro (EUR) against listed major currencies today. Euro was the strongest against the Japanese Yen.
| USD | EUR | GBP | JPY | CAD | AUD | NZD | CHF | |
|---|---|---|---|---|---|---|---|---|
| USD | -0.28% | 0.41% | 0.68% | 0.02% | 0.11% | 0.13% | 0.05% | |
| EUR | 0.28% | 0.69% | 0.97% | 0.30% | 0.40% | 0.41% | 0.33% | |
| GBP | -0.41% | -0.69% | 0.27% | -0.38% | -0.30% | -0.28% | -0.36% | |
| JPY | -0.68% | -0.97% | -0.27% | -0.64% | -0.57% | -0.55% | -0.62% | |
| CAD | -0.02% | -0.30% | 0.38% | 0.64% | 0.08% | 0.11% | 0.03% | |
| AUD | -0.11% | -0.40% | 0.30% | 0.57% | -0.08% | 0.02% | -0.06% | |
| NZD | -0.13% | -0.41% | 0.28% | 0.55% | -0.11% | -0.02% | -0.08% | |
| CHF | -0.05% | -0.33% | 0.36% | 0.62% | -0.03% | 0.06% | 0.08% |
The heat map shows percentage changes of major currencies against each other. The base currency is picked from the left column, while the quote currency is picked from the top row. For example, if you pick the Euro from the left column and move along the horizontal line to the US Dollar, the percentage change displayed in the box will represent EUR (base)/USD (quote).
