- The US Dollar strengthens as 10-year US yields rise to 4.70%.
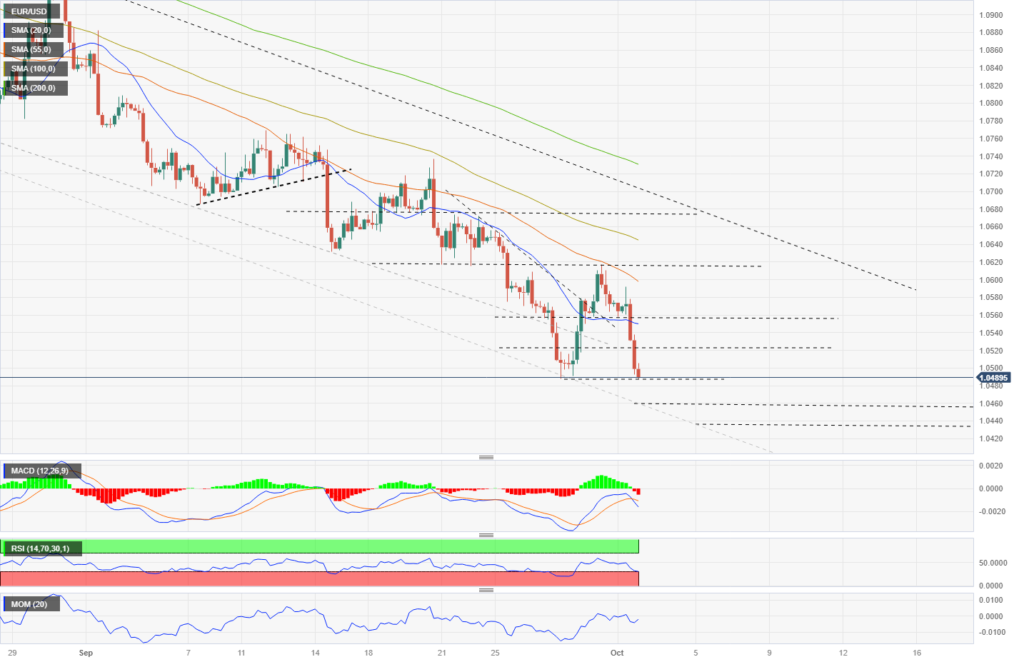
- The EUR/USD erases two-day gains and hits fresh YTD lows below 1.0500.
- The next support area for the pair is at 1.0460.
The EUR/USD lost over a hundred pips on Monday, resuming the downside that started on Friday’s American session, dropping below 1.0500 to hit multi-month lows. The pair remains under pressure after the short-lived rebound.
The key driver for EUR/USD continues to be the strong US Dollar. The combination of risk-off sentiment in global markets and higher yields continues to add fuel to the US Dollar Index (DXY). The DXY is slightly below 107.00, rising for the sixth day out of the last seven days. Wall Street posted mixed results after the relief rally following the agreement among US lawmakers to avoid a government shutdown. At the same time, US yields remain firm, with the 10-year reaching 4.70% for the first time since 2007, as Federal Reserve officials speak about the resilience of the economy.
Data from the US came in above expectations, with the ISM Manufacturing PMI at 49 in September, surpassing the market consensus of 47.7. On Tuesday, the JOLTS report is due, followed by the ADP report on Wednesday. The crucial point for labor market data will be on Friday with the Nonfarm Payrolls. Weaker-than-expected data could dampen the advance of the US Dollar, while more upbeat data would strengthen the Greenback further as it would reinforce expectations of another rate hike from the Fed.
In the Eurozone, the unemployment rate dropped as expected from 6.5% to 6.4% in August. The final reading of the Manufacturing PMI for the region was confirmed at 43.4. No data is scheduled from the Eurozone on Tuesday.
EUR/USD short-term technical outlook

The chart shows a clear downward direction in EUR/USD, with the price testing the 1.0480 area. A break below this level would open the way to further losses, with the next immediate support around 1.0460. If this level is reached, it could potentially result in a consolidation or a modest rebound. However, a break lower could lead to an acceleration of the downward move.
On the upside, the initial resistance is around the 1.0525 area, followed by 1.0550, which is a confluence of a horizontal resistance area and the 20-Simple Moving Average (SMA) in the 4-hour chart. A recovery above 1.0550 would improve the outlook for the Euro. Technical indicators on the intermediate charts show a bearish bias, with the Relative Strength Index (RSI) below 30, indicating oversold levels.
View Live Chart for the EUR/USD
