USD: Jun ’25 is Down at 100.180.
Energies: Jun ’25 Crude is Down at 61.20.
Financials: The Jun ’25 30 Year T-Bond is Higher by 8 ticks and trading at 113.01.
Indices: The Jun ’25 S&P 500 emini ES contract is 42 ticks Lower and trading at 5972.00.
Gold: The Jun’25 Gold contract is trading Up at 3240.90.
Initial conclusion
This is not a correlated market. The USD is Down and Crude is Down which is not normal, but the 30 Year T-Bond is trading Higher. The Financials should always correlate with the US dollar such that if the dollar is Higher, then the bonds should follow and vice-versa. The S&P is Lower and Crude is trading Lower which is not correlated. Gold is trading Higher which is correlated with the US dollar trading Down. I tend to believe that Gold has an inverse relationship with the US Dollar as when the US Dollar is down, Gold tends to rise in value and vice-versa. Think of it as a seesaw, when one is up the other should be down. I point this out to you to make you aware that when we don’t have a correlated market, it means something is wrong. As traders you need to be aware of this and proceed with your eyes wide open. All of Asia traded Lower with the exception of the Shanghai exchange which is Higher. All of Europe is trading Higher except the Paris and Milan exchanges.
Possible challenges to traders
- FOMC Member Barkin Speaks at 9 AM EST. This is Major.
- FOMC Member Bostic Speaks at 9 AM EST. This is Major.
- FOMC Member Musalem Speaks at 1 PM EST. This is Major.
- No Major economic news to speak of.
Traders, please note that we’ve changed the Bond instrument from the 10 Year (ZN) to the 2 Year (ZT). They work exactly the same.
We’ve elected to switch gears a bit and show correlation between the 2-year Treasury notes (ZT) and the S&P futures contract. The YM contract is the Dow Jones Industrial Average, and the purpose is to show reverse correlation between the two instruments. Remember it’s likened to a seesaw, when up goes up the other should go down and vice versa.
Yesterday the ZT climber Higher at around 8 AM EST with no news pending. The Dow dived Lower at the same time. Look at the charts below and you’ll see a pattern for both assets. The Dow moved Lower at 8 AM EST and the ZT charged Higher at around the same time. These charts represent the newest version of Bar Charts, and I’ve changed the timeframe to a 15-minute chart to display better. This represented a Long opportunity on the 2-year note, as a trader you could have netted 20 plus ticks per contract on this trade. Each tick is worth $6.25. Please note: the front month for ZT is now Jun ’25 and the Dow is Jun ’25 as well. I’ve changed the format to filled Candlesticks (not hollow) such that it may be more apparent and visible.
Charts courtesy of barcharts
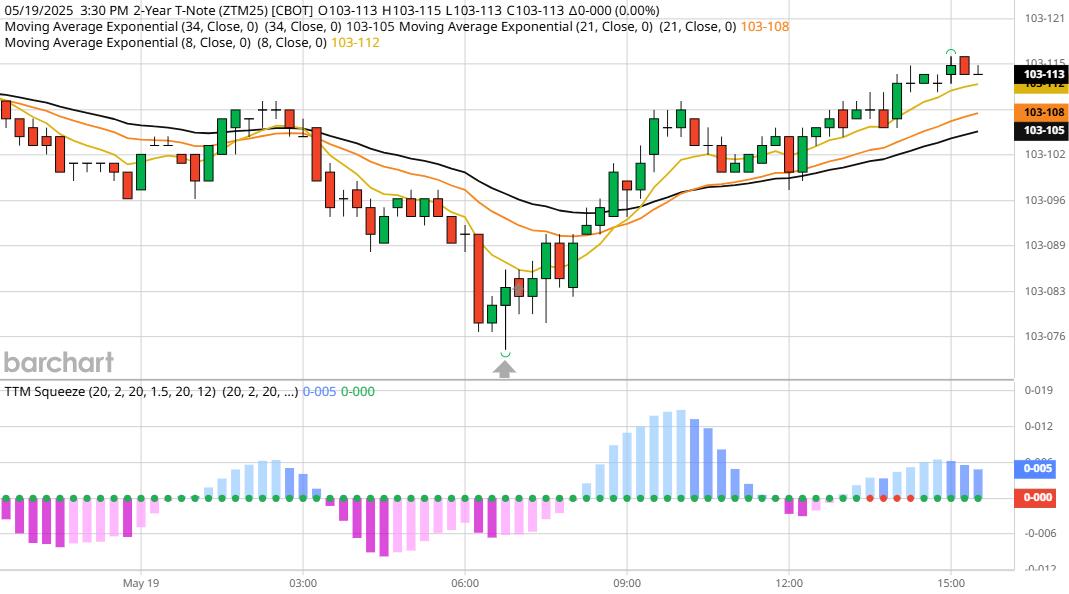
ZT -Jun 2025 – 5/19/25
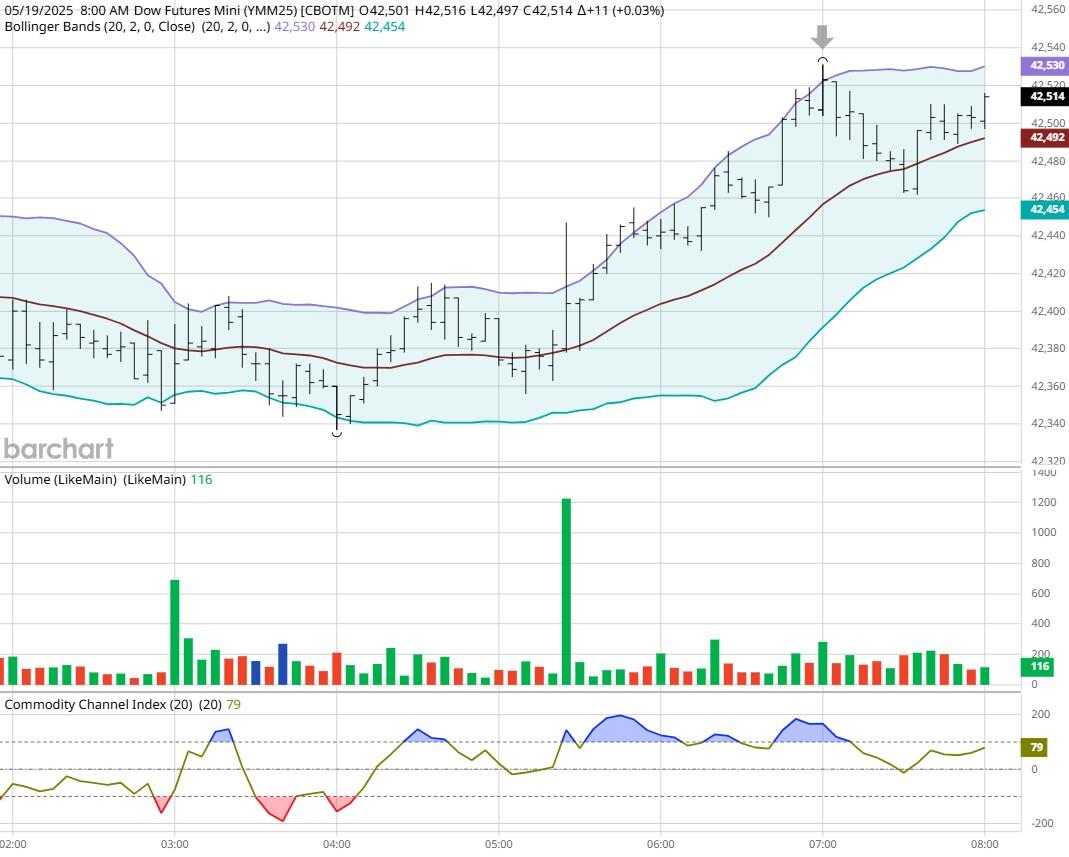
Dow – Jun 2025- 5/19/25
Bias
Yesterday we gave the markets a Downside bias. The indices however had other ideas as the Dow closed 137 points Higher and the other indices closed Higher as well. Today we aren’t dealing with a correlated market, and our bias is Neutral or Mixed.
Could this change? Of Course. Remember anything can happen in a volatile market.
Commentary
So, Sunday evening Moody’s decided to downgrade US debt from triple A to a lower grade. One would think that this would serve to torpedo the markets but that didn’t happen as the markets rose. The same situation occurred during the Obama administration and that didn’t drag the markets down either. Remember US debt is backed by the Government and is the only instrument that does that.