S&P 500 E-mini futures find support at key levels — Twice
A review of the weekly chart for the S&P 500 e-mini futures (ES) shows how this market has respected key Fibonacci retracement levels during major pullbacks—an insight that can help traders and investors assess the strength of the broader trend.
What happened
October 2022 low:
After a sharp decline from its pandemic-era peak, the S&P 500 e-mini futures (ES) bottomed in October 2022 around 3500. As shown in the chart, this low aligned precisely with the 50% Fibonacci retracement level of the March 2020 low to January 2022 high rally. While the 50% retracement is not a true Fibonacci ratio, it is widely used by traders because markets often retrace about half of a major move before resuming its trend.
April 2025 low:
In 2025, after a new all-time high in February near 6166, the S&P 500 e-mini futures (ES) pulled back again and found support at the 50% retracement level—this time around 4834, marking half of the 2022 low to 2025 high range. This marks the second significant instance where price action respected the 50% level, as highlighted on the chart.
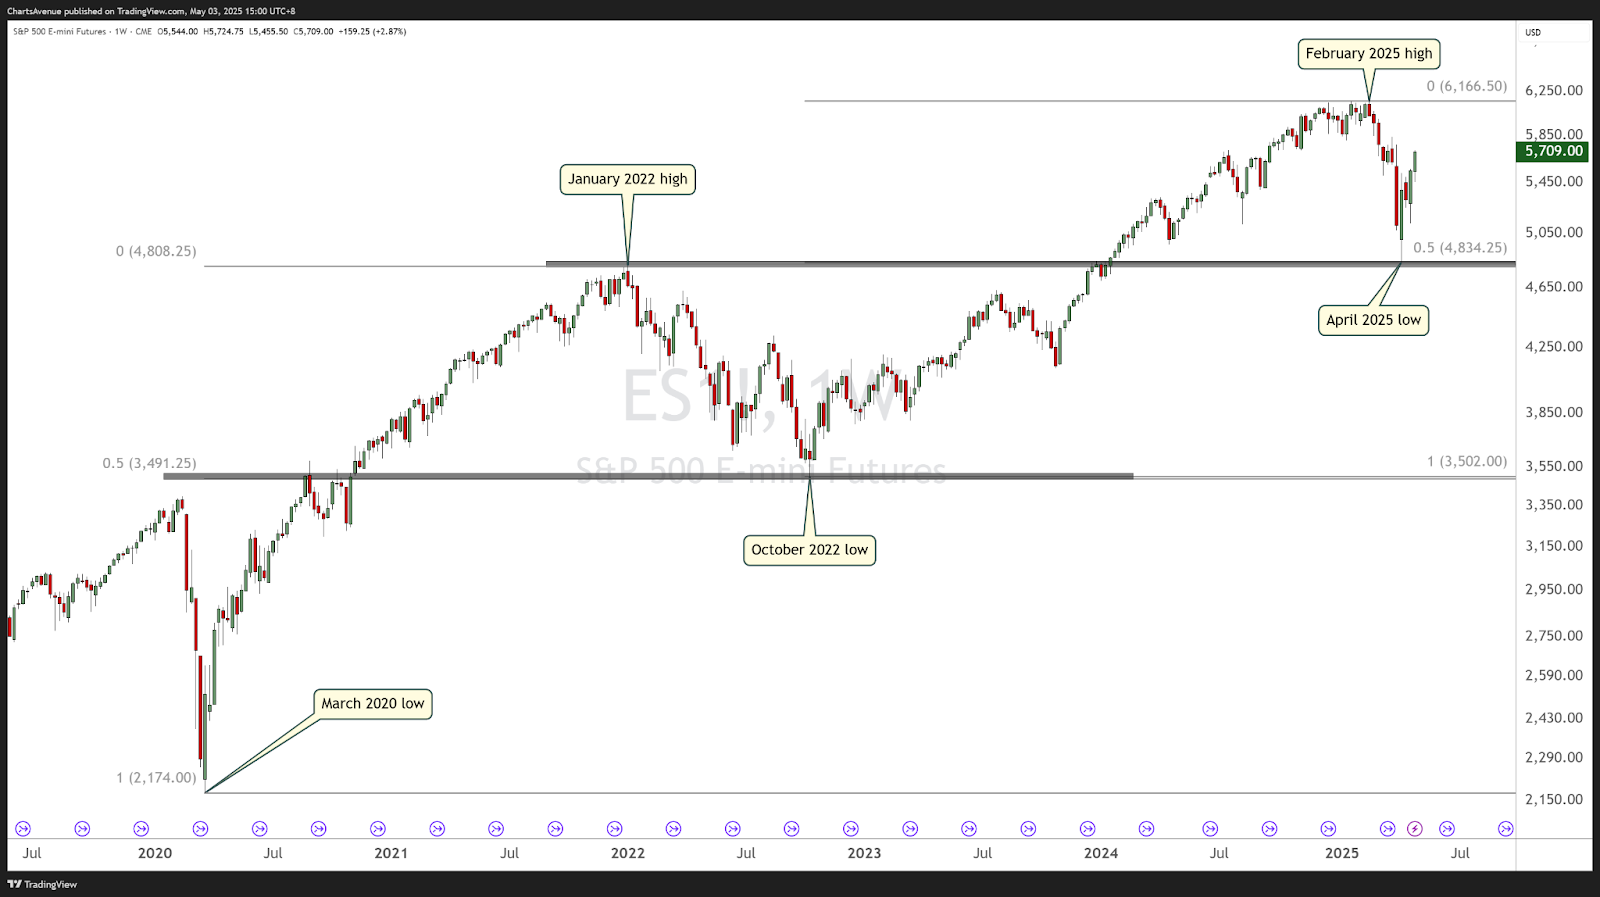
Why it matters
The chart clearly shows how the S&P 500 e-mini futures (ES) bounced from the 50% retracement level twice on a weekly timeframe, reinforcing the role of Fibonacci retracements as key support zones for potential reversal points.
When price holds above this retracement, it suggests the primary uptrend remains intact. Conversely, a breakdown below the 50% level might shift focus toward the deeper 61.8% retracement, seen as the next major support zone before a potential trend reversal.
By respecting once again a key Fibonacci retracement level (bouncing decisively from support in April), the primary trend is up, and the broader technical outlook remains bullish as long as the price does not break below the 4800 area.
Tesla tests critical resistance: A make-or-break moment
The daily chart of Tesla (TSLA) highlights a rebound from the 78.6% Fibonacci retracement level of its April to December 2024 uptrend. During this pullback, the price was able to close two previous gaps (red circles).
Currently, TSLA is challenging a cluster of resistance:
- The descending trendline from its 2024 high (in black),
- The 200-day moving average, around $292 (in red),
- And the psychological round number of $300.
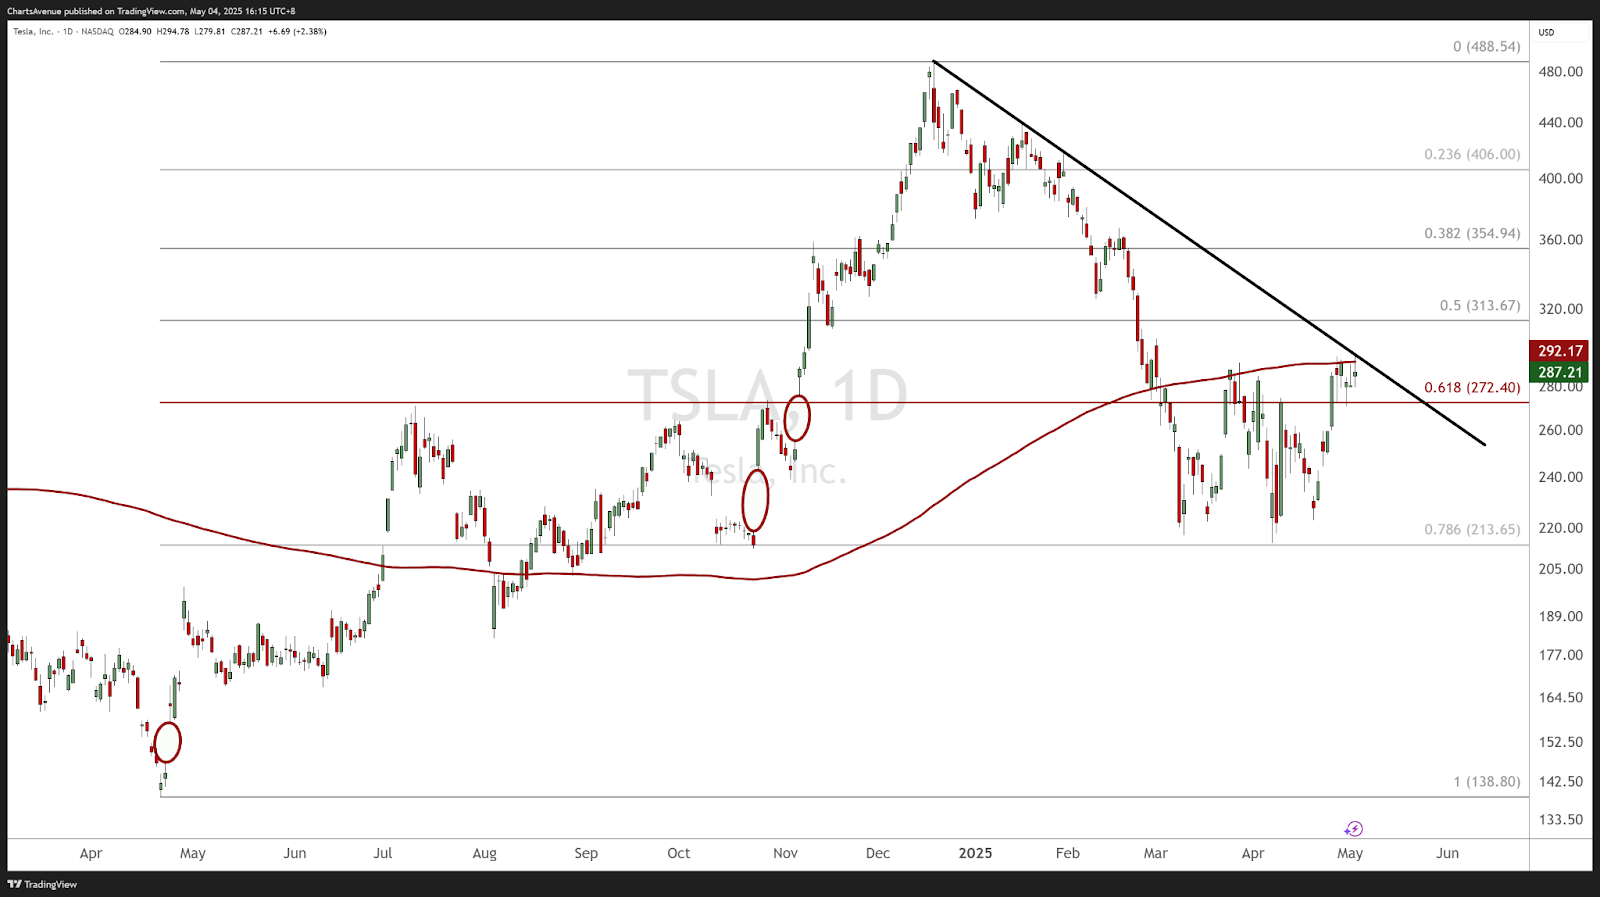
This setup is pivotal. A sustained breakout above these levels could trigger a renewed uptrend, targeting the 50% retracement level near $313 first and followed by the next Fibonacci level around $355. Conversely, a price rejection here may affirm the prevailing downtrend and invite renewed selling pressure back toward the $213 area (78.6% retracement).
The bottom line
Tesla’s rebound shows strength, but until price closes decisively above the descending trendline and 200-day moving average, the broader trend remains bearish. Traders and investors should wait for a confirmation of a breakout before adopting a bullish bias.
USD/JPY head and shoulder top or triple bottom ?
A look at the weekly chart of the USD/JPY shows a well-defined head and shoulders pattern developing. This is typically a bearish reversal setup, suggesting that sellers are attempting to turn the broader trend lower.
The pattern consists of:
- Left shoulder (fall 2023),
- Head (summer 2024 high),
- Right shoulder (winter 2024/25).
The neckline, located around the 139–140 area, has been tested three times and continues to hold firm. While the pattern itself implies downside risk, it’s important to note that no breakdown has occurred yet. As long as price remains above the neckline, this area acts as strong support, reflecting persistent buying interest.
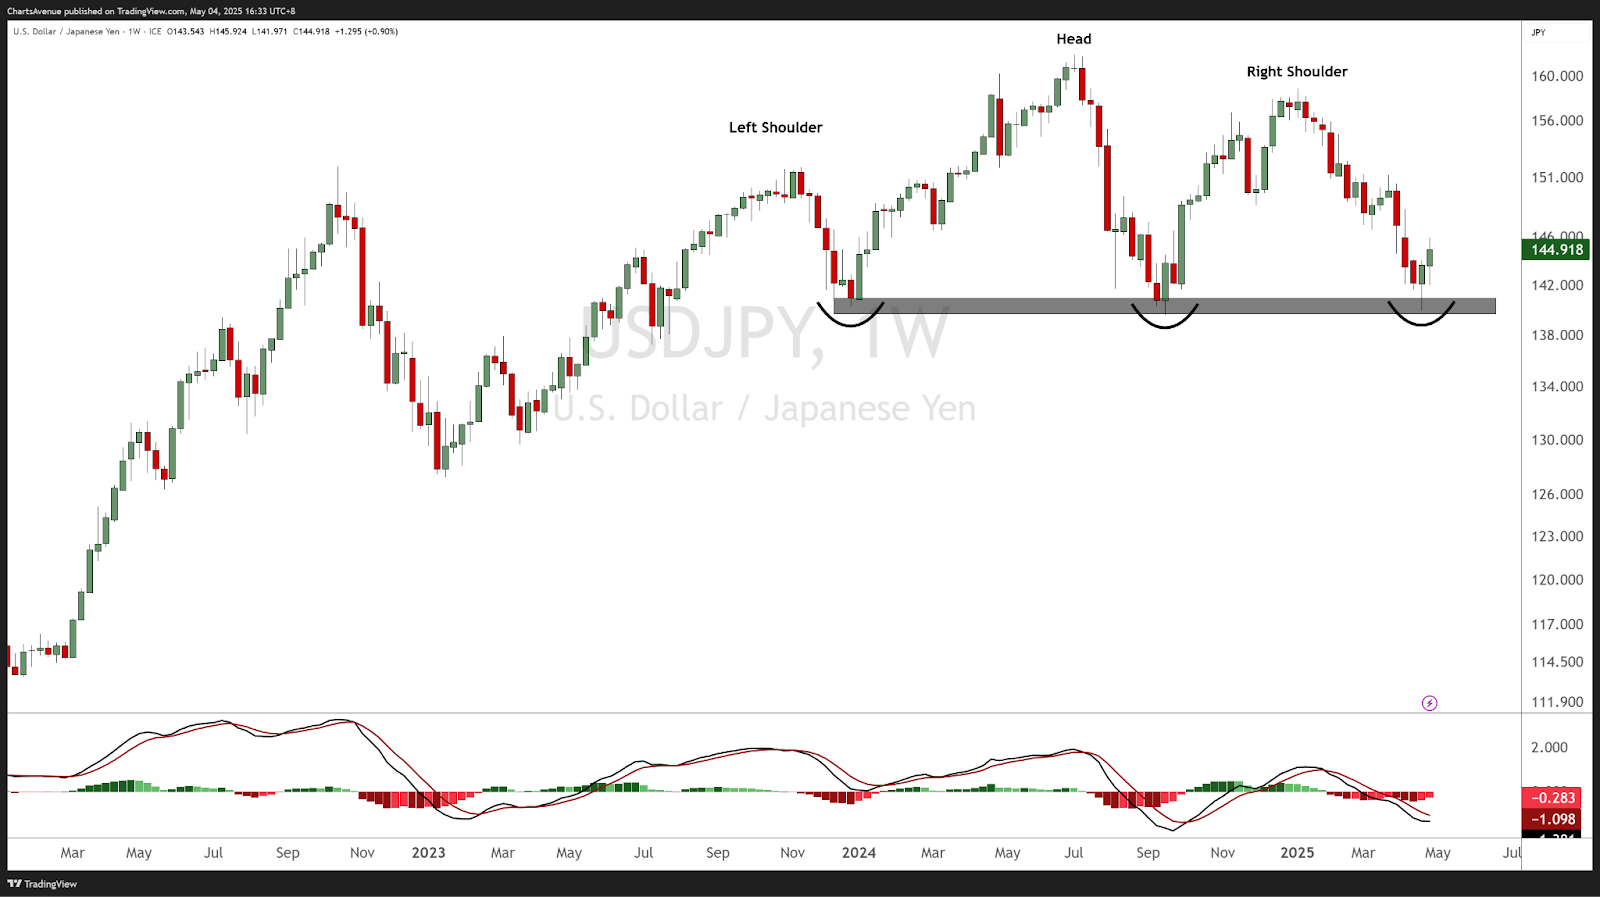
Interestingly, the repeated accumulation around these levels could invalidate the bearish head and shoulders setup if buyers maintain control and push price back toward the highs. A confirmed breakdown below the neckline would be required to validate the bearish outlook.
From a momentum perspective, the MACD is showing signs of stabilization, hinting that bearish momentum is fading. A bullish MACD crossover could further support the case for a reversal higher.
The bottom line
While USD/JPY is forming a potential bearish topping pattern, the technical picture remains neutral-to-bullish until the neckline breaks decisively. Traders should monitor closely: a sustained hold above 139 keeps the broader uptrend alive, while a breakdown could trigger a significant bearish move towards 126.50.